![]() Data source for reference structures
Data source for reference structures
Before the structural context of ELM matches can be evaluated, it is necessary to define and select the structural unit. Structure files may contain large protein complexes, single proteins, single or multiple chains, single globular domains and many other types of molecule. The dependency of ELM accessibility on globular domain rearrangements implies that multi-domain structures are not a suitable structural unit for structure filtering. The appropriate units therefore appear to be the individual globular domains themselves. Therefore we chose the SCOP protein domain definition as provided by the ASTRAL resource as the reference structure dataset to be used to implement the structure filter.
The user-submitted query sequence is first scanned for ELM matches and then aligned to the database of ASTRAL sequences derived from SCOP domains. The hit with the highest sequence identity and coverage to the query sequence is selected as the reference structure. If more than one hit has the same sequence identity and coverage to the query sequence, the structure with the best experimental resolution is taken as reference and, for the same resolution, one hit is chosen randomly. This approach may result in, for example, the organism source of the reference structure being different from the organism source of the user query sequence. However, since proteins with identical sequences fold into identical structures, the procedure for the selection of the reference structure will only introduce minimal bias in the calculation of solvent accessibility and secondary structure values.
For the structure filter to be applicable, two conditions must hold:
1) it is possible to align the query sequence or a region of it to one or more (non-overlapping) structural domains.
(≥70% identity to the query sequence)
2) at least one ELM match falls in an aligned region, i.e. can be mapped onto a 3D domain.
![]() Accessibility and secondary structure assignment
Accessibility and secondary structure assignment
The solvent accessibility and secondary structure values are collected from DSSP
files. For the solvent exposure of a residue, a relative (normalized) value is calculated
as the ratio of the residue's accessibility DSSP value to the residue accessible surface
area value as defined by Miller and co-workers (Miller et al., 1987). The latter is
calculated for the residue in a Gly-Xaa-Gly tripeptide in extended conformation.
The relative accessibility varies between 0 and 1.5.
The DSSP secondary structure types are: H = alpha helix, B = residue in isolated beta-bridge, E = extended strand (participates in beta ladder),
G = 3-helix (3/10 helix), I = 5 helix (pi helix), T = hydrogen bonded turn, and S = bend. Unstructured regions are marked as U.
In our study we
grouped the SSE types into four categories:
1) helices (H, I)
2) 3/10 helices (G)
3) strand (E)
4) loops (B, T, S, U).
Pi helices are usually attached
to larger alpha helices; therefore we grouped them with helices. 3/10 helices are often poorly conserved as part of a larger loop but sometimes they are
continuously linked to a larger helix and so it was decided to treat them separately. B, T, S and U are grouped together because they usually belong to 3D flexible loop-like regions.
![]() Score of an individual position
Score of an individual position
Based on the structural study of true motifs, accessibility (qacc (i)) and
secondary structure (qsse (i)) score of a position i are assigned as follows:
Accessibility:
0.0 <= qacc(i) <= 1.5
Secondary structure :
strand: qsse (i) = 0.35
helix: qsse(i) = 0.55
3/10-helix: qsse (i) = 1.33
loop: qsse (i) = 1.5
Given a motif match that can be modeled onto a structure domain
and such that N is the number of non-wildcard positions of a match, Ω is the set of non-wildcard positions and
i stands for a non-wildcard position,
its Qacc and Qsse scores are evaluated as:
Qacc (match) = ∑(qacc (i))/N, where i ∈ Ω
Qsse (match) = ∑(qsse (i))/N, where i ∈ Ω
the total combined score on non-wildcard positions Qand
is simply evaluated as:
Qand (match) = Qacc (match) + Qsse (match)
A p-value is assigned to each score of an ELM match. This p-value is a conservative estimate of the probability thatan ELM prediction with a given score is a true positive; more specifically, it is the probability of obtaining a random
match with a score at least as high as the one that was actually observed, and therefore we expect it to be very stringent. In this test, the significance cut-off is 10e-2. The closer the p-value of a motif is to this value, the better the motif candidate is, and the more likely it is to survive experimental validation. (But remember: WHOLE context matters e.g. if the protein resides in the wrong cell compartment for this functionality, then it will simply be false regardless of p-value.)
The benchmark consists of the whole set of ELM true motifs that can be mapped onto a domain structure (at ≥ 70% sequence similarity). A set of random matches is determined as well. Our benchmark is composed of 158 reliable true motif instances and 22,058 random matches.
An accessibility score (Qacc), a secondary structure score (Qsse) and a combined score
(Qand = Qacc + Qsse) was
assigned to the true motif instances of our dataset by considering non-wildcard positions only and to the random matches
of the random dataset by considering non-wildcard positions only. The corresponding percentiles for the accessibility score (Qacc),
secondary structure score (Qsse) and combined score (Qand = Qacc + Qsse) were plotted as functions of
the score (Fig. 1, 2, 3, respectively).
In order to futher assess the discriminative power of our scoring scheme and establish if one score is more discriminative than an other, we
plotted ROC curves (Fig.4). The ROC curves show that all score types enable discrimination between true motifs and random matches (where it
is assumed that random matches are all false positive matches)
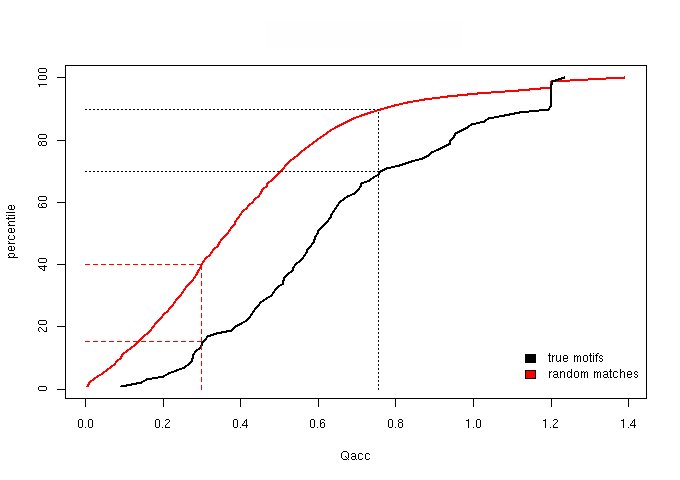
Figure 1 - The cumulative distribution of the Qacc (accessibility score)
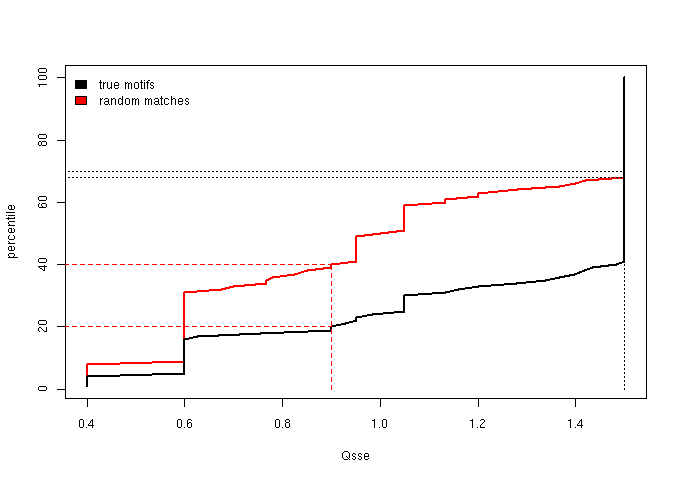
Figure 2 - The cumulative distribution of the Qsse (secondary structure score)
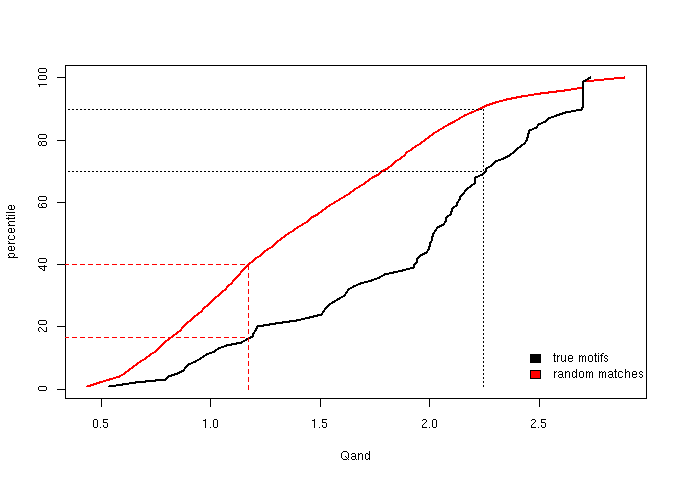
Figure 3 - The cumulative distribution of Qand = Qacc + Qsse
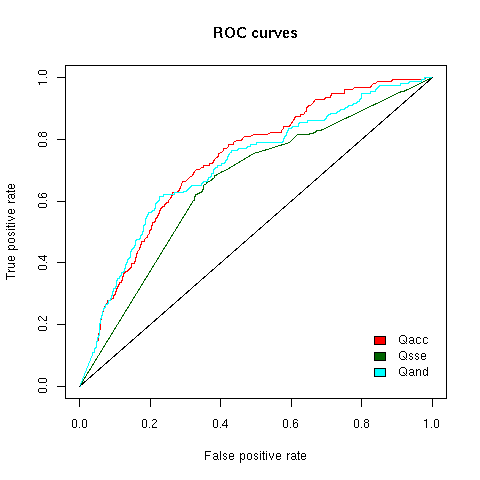
Figure 4 - ROC curves for Qacc, Qsse and Qand = Qacc + Qsse score
Based on the percentile plots, we established two score thresholds aimed at defining three score bins: one, “sparse”, lacking in true motifs
and enriched in random matches, one identifying “neutral” matches, and one lacking in random matches and “enriched” in true motifs.
This “three bins” scheme roughly
means that a predicted match, which is assigned a score in the “enriched” interval, will be indicated by our procedure as a good true motif candidate (i.e. likely
to be a valid functional site), motif matches scoring in the bottom interval (“sparse” interval) as unlikely to be valid functional sites and those ranking in the
middle one as “neutral”.
We then chose score thresholds that guarantee that at least the top 30% true motifs are retained in the enriched bin and at least the lower 40% random matches fall
in the sparse bin. The “neutral” bin is the middle one, naturally defined by the “sparse” and “enriched” cut-offs and will contain the medium quality
matches. The score thresholds implemented are those considering non-wildcard positions only as these displayed the highest ratio value in the
“enriched” bin.
| range | colour | accessibility and 2D structure combined score conditions |
| sparse context | grey | Qand ≤ 1.173 |
| neutral context | half blue, half grey | 1.173 < Qand < 2.243 |
| enriched context | blue | Qand ≥ 2.243 |
![]() Background score distributions
Background score distributions
Due to the paucity of true motif data, we cannot build a true motif score distribution for each ELM and compare it to the corresponding random motif score distribution. However, we can build
ELM-specific random score distributions and use them as background score contexts, telling us something about the average behavior (in terms of accessibility and secondary structure scores),
on a large dataset of structures, of each single ELM. These distributions aim to help users in placing the score of their prediction in the proper score background context.
ELM data can be downloaded & distributed for non-commercial use according to the ELM Software License Agreement